Insights for New Airbnb Hosts: A Data-Driven Analysis of Vancouver’s Airbnb Dataset with BC Assessment, Cultural Spaces and Translink Datasets
Project Link: https://github.com/StellaLii/Airbnb-Project
1 Introduction
The sharing economy has experienced significant growth in recent years, with platforms like Airbnb revolutionizing the way people travel and seek accommodations. Understanding the factors that drive pricing and review ratings in the Airbnb market is essential for both hosts and guests, as well as policymakers and researchers interested in the impact of short-term rentals on housing markets, local economies, and cultural landscapes.
2 Dataset
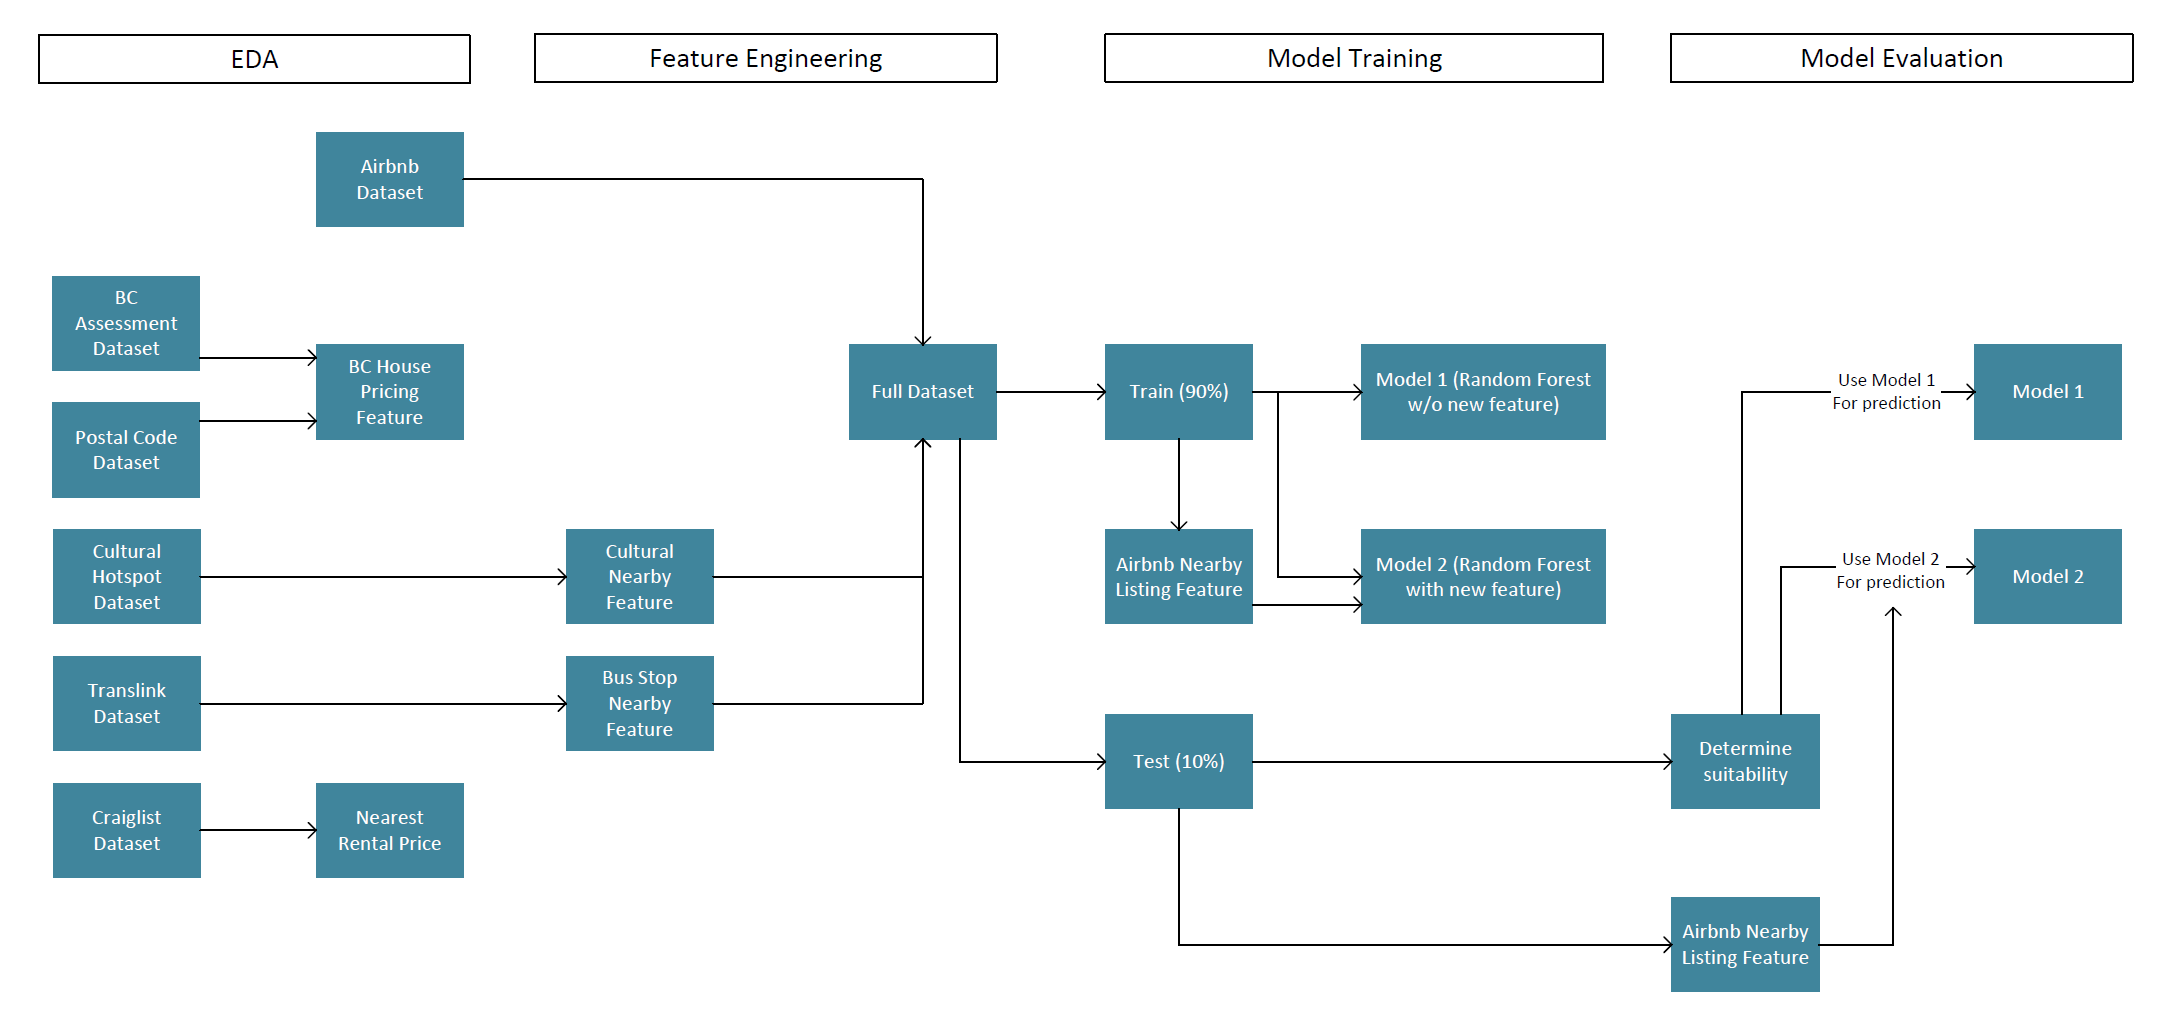
3 Data Science Pipline
4 EDA
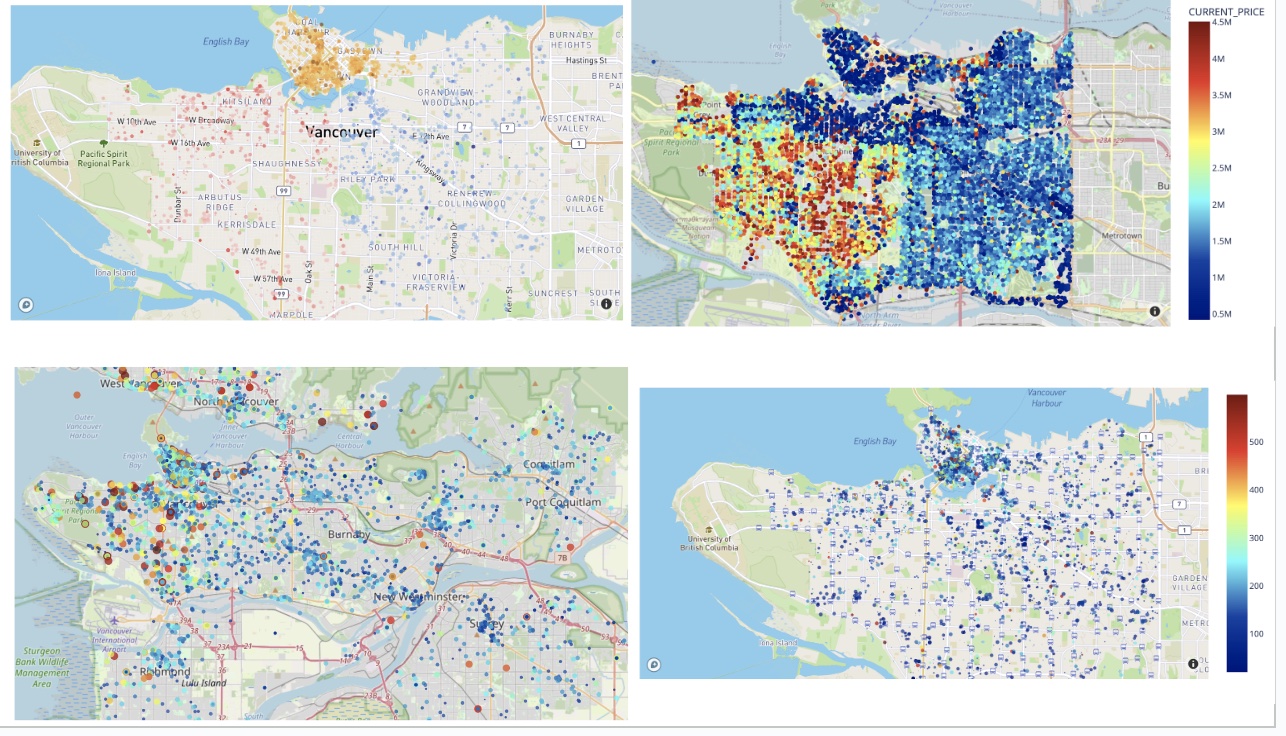
EDA offers an in-depth analysis of the distribution of Airbnb listing prices, housing prices, and rental prices, and also looked into how cultural space and public transportation affected the Airbnb listing prices
5 Machine Learning
5.1 Feature Engineering
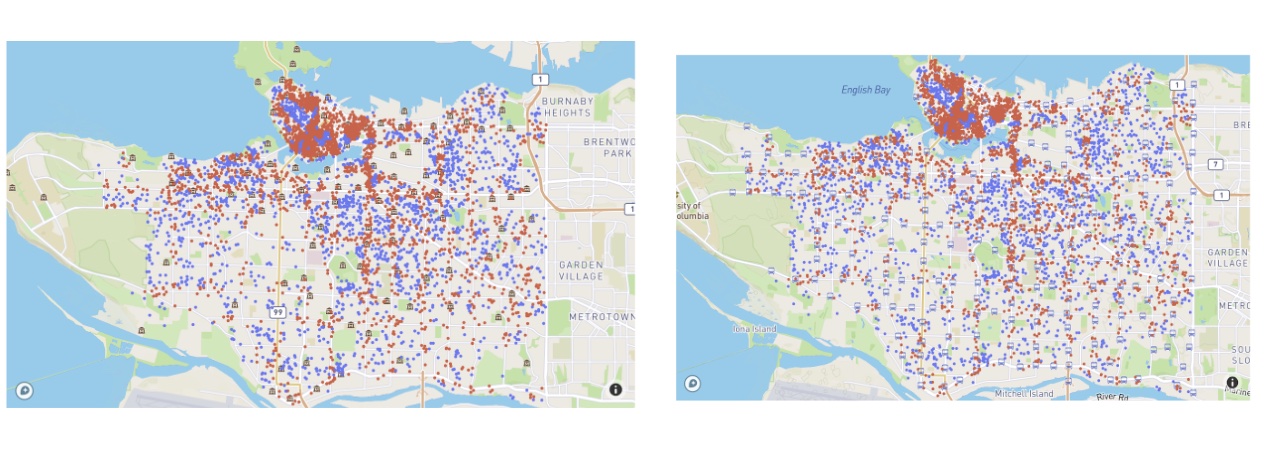
Feature engineering enhances the dataset with new features, such as proximity to transit stations and cultural spaces, which can be crucial factors for guests and property owners. Machine learning models, like random forests and gradient boosting tree, predict Airbnb listing prices and rank influential factors, providing insights into the market’s driving forces.
5.2 Feature Selection
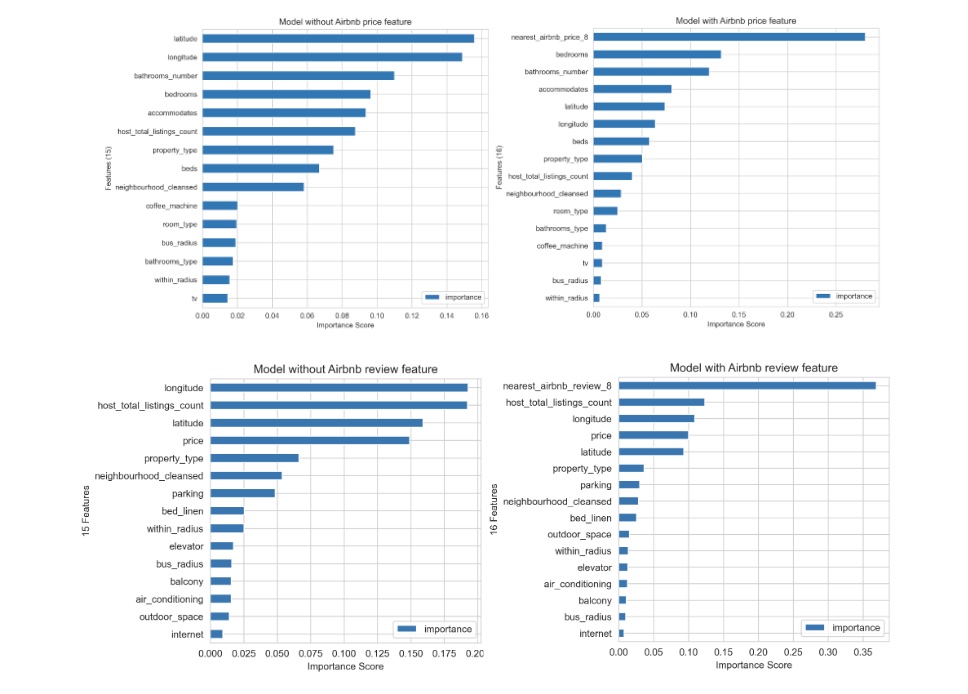
We employed mutual information (MI) to select the top 15 features with the highest MI value for both models. Below are the feature importance plots for the models, which show the relative contribution of each feature to the model’s predictions.
5.3 Model Section & Training
We trained and compared the same five models: KNN, SVR, Random Forest, Gradient Boosting Tree, and Lasso Regression. We assessed their performance based on the RMSE and MAE metrics. And we choose the Random Forest and Gradient Boosting Tree model based on their performance.

5.4 Model Evaluation
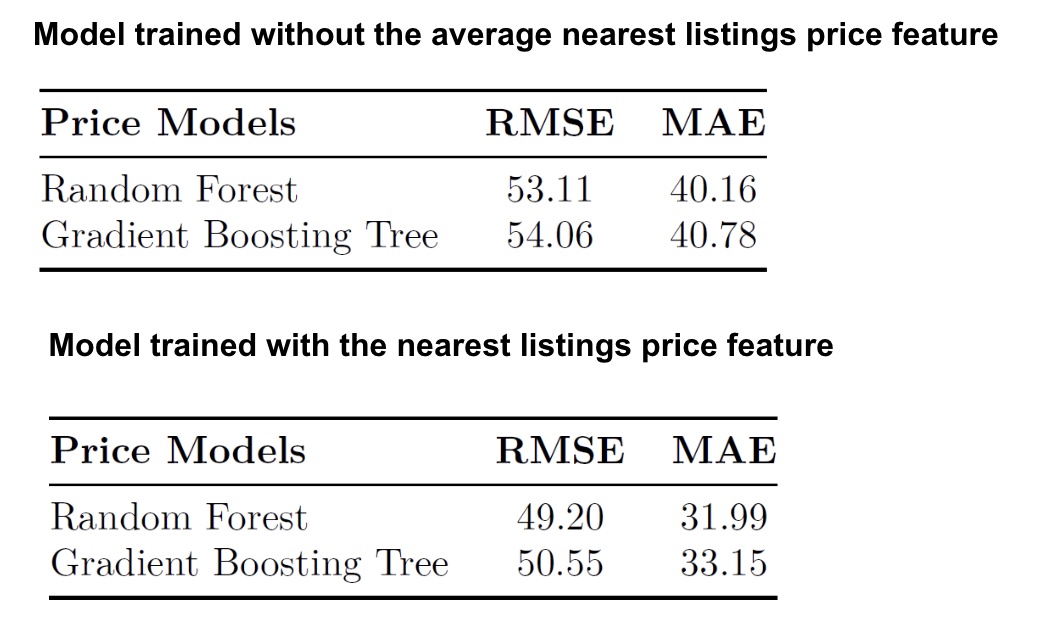
The Random Forest model, which was trained without the nearest listings price feature, achieved a Root Mean Squared Error (RMSE) of 53.11, outperforming the gradient boosting model by a slight margin.
When the Random Forest model was trained with the nearest listings price feature, its Root Mean Squared Error (RMSE) was approximately 49.20, which is lower than that of gradient boosting tree.
5.5 Model Interpretability
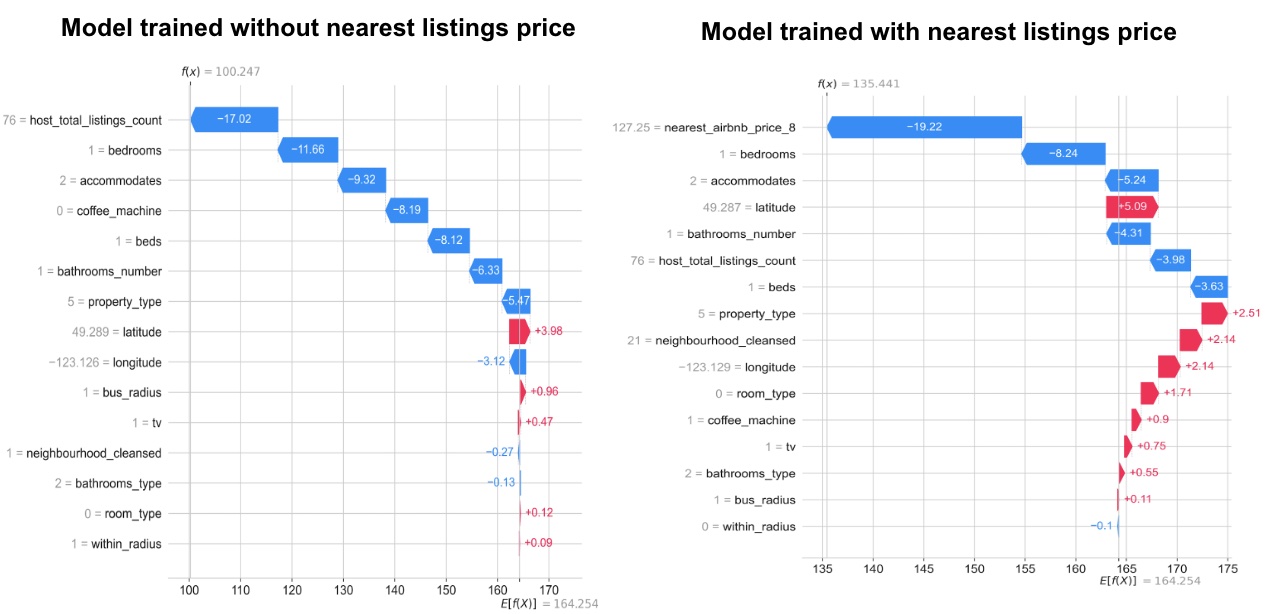
We utilized the SHAP library to interpret the model output by displaying the contributions of each individual feature to the predicted value.
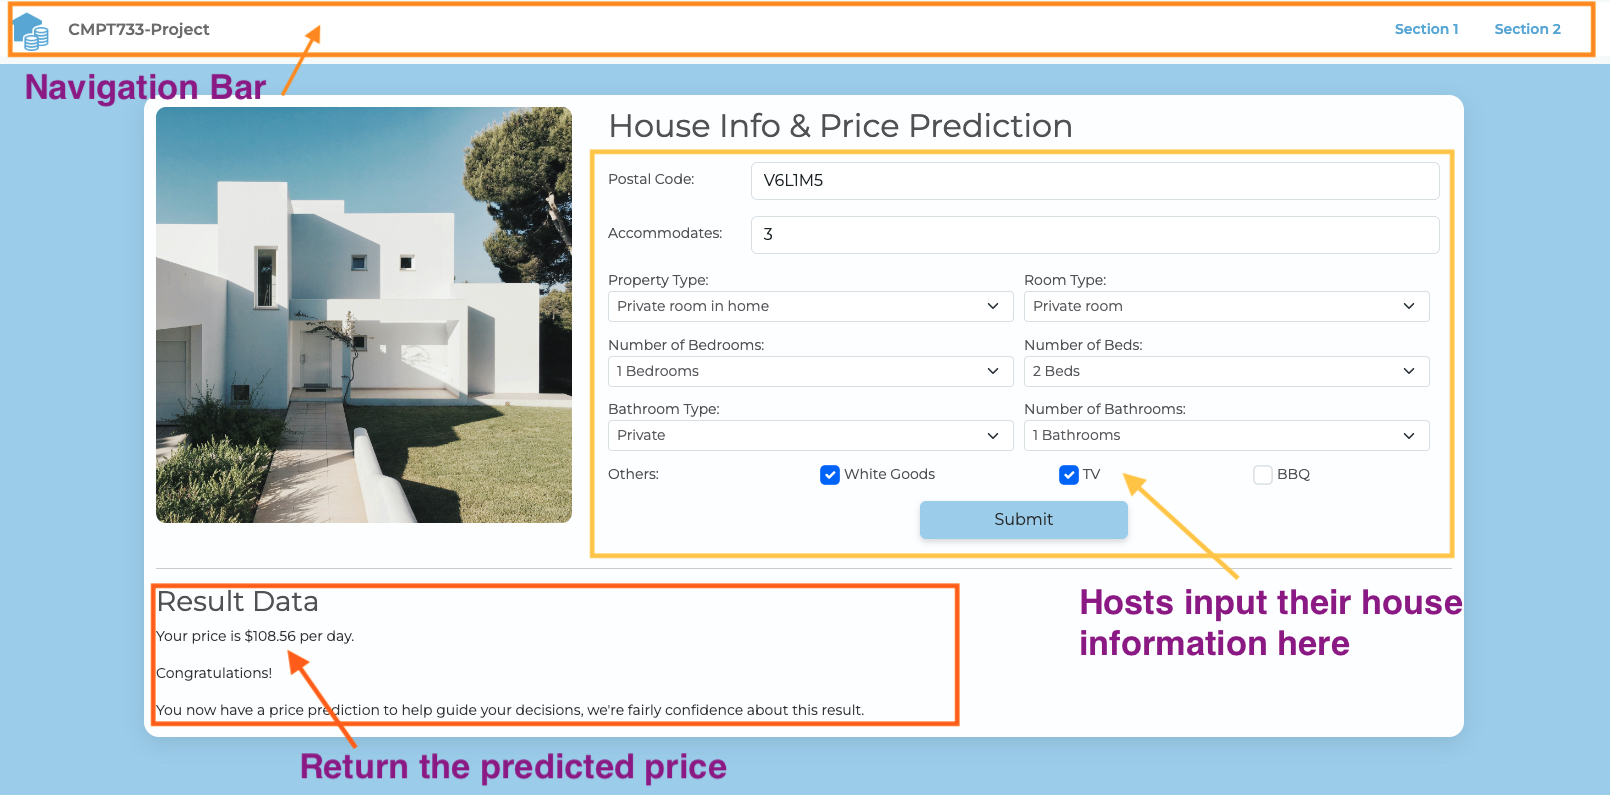
6 Data Product
