The-SP500-Index-and-Selective-Stocks-Data-Project
This project is designed for rookie investors, which help them better understand the capital market from the Macro Index, such as S&P 500 index. From the selected stocks in S&P 500, we made further analysis show them how to choose good-quality stocks. According to our outcomes, our project is good tool to let people understand the correlation of macro index and the economy, the trend and forecast of stocks, and how to choose the right time to invest.
1 Topic:
S&P 500 index & stock analysis and forecast for beginners
Project Link: https://github.com/StellaLii/The-SP500-Index-and-Selective-Stocks-Data-Project
2 Methodology

2.1 Data Introduction
The data we need for this project is from an authoritative financial institution, Yahoo Finance.
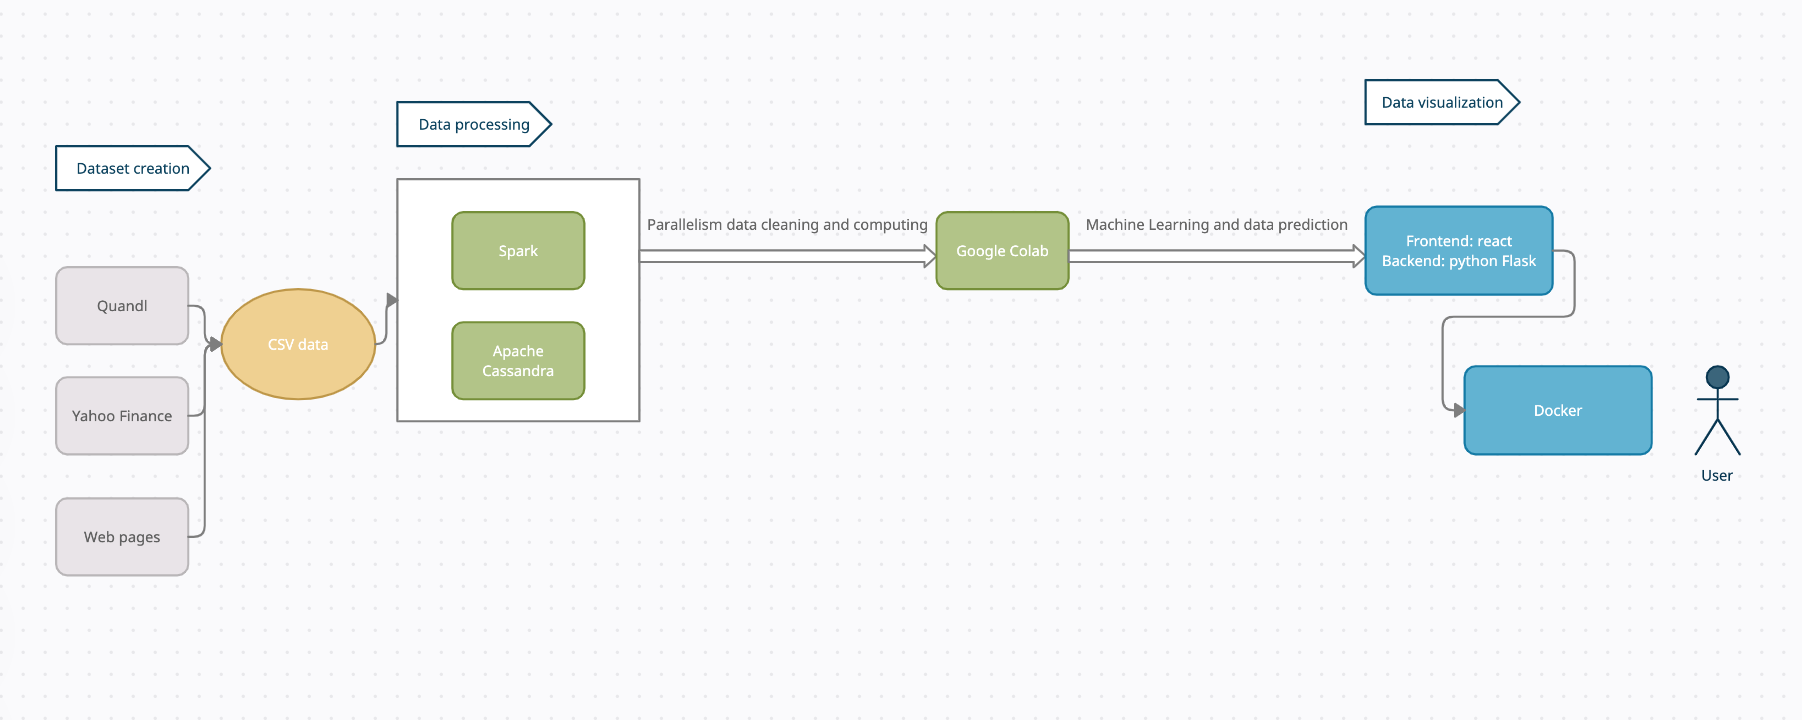
We are collecting (over 100MB data) from various sources including Quandl API(Quandl, Nasdaq Data Link), Yahoo Finance(yfinance package) and data retrieved from Web pages(XML data from curl result). We aggregated our data from different sources into CSV files for better data processing and data availability.

2.2 ETL
Duplicate data handling before loading to Cassandra. We choose Cassandra because it is a distributed database.
2.3 Algorithm
We used multiple methods to analyze the historical data, including time series analysis and time series decomposition.
In time series analysis, we compared several typical indexes, including simple moving average, exponential moving average, relative strength index, moving average convergence divergence. For time series decomposition, we decomposed using three different frequencies, which is daily, monthly, yearly.
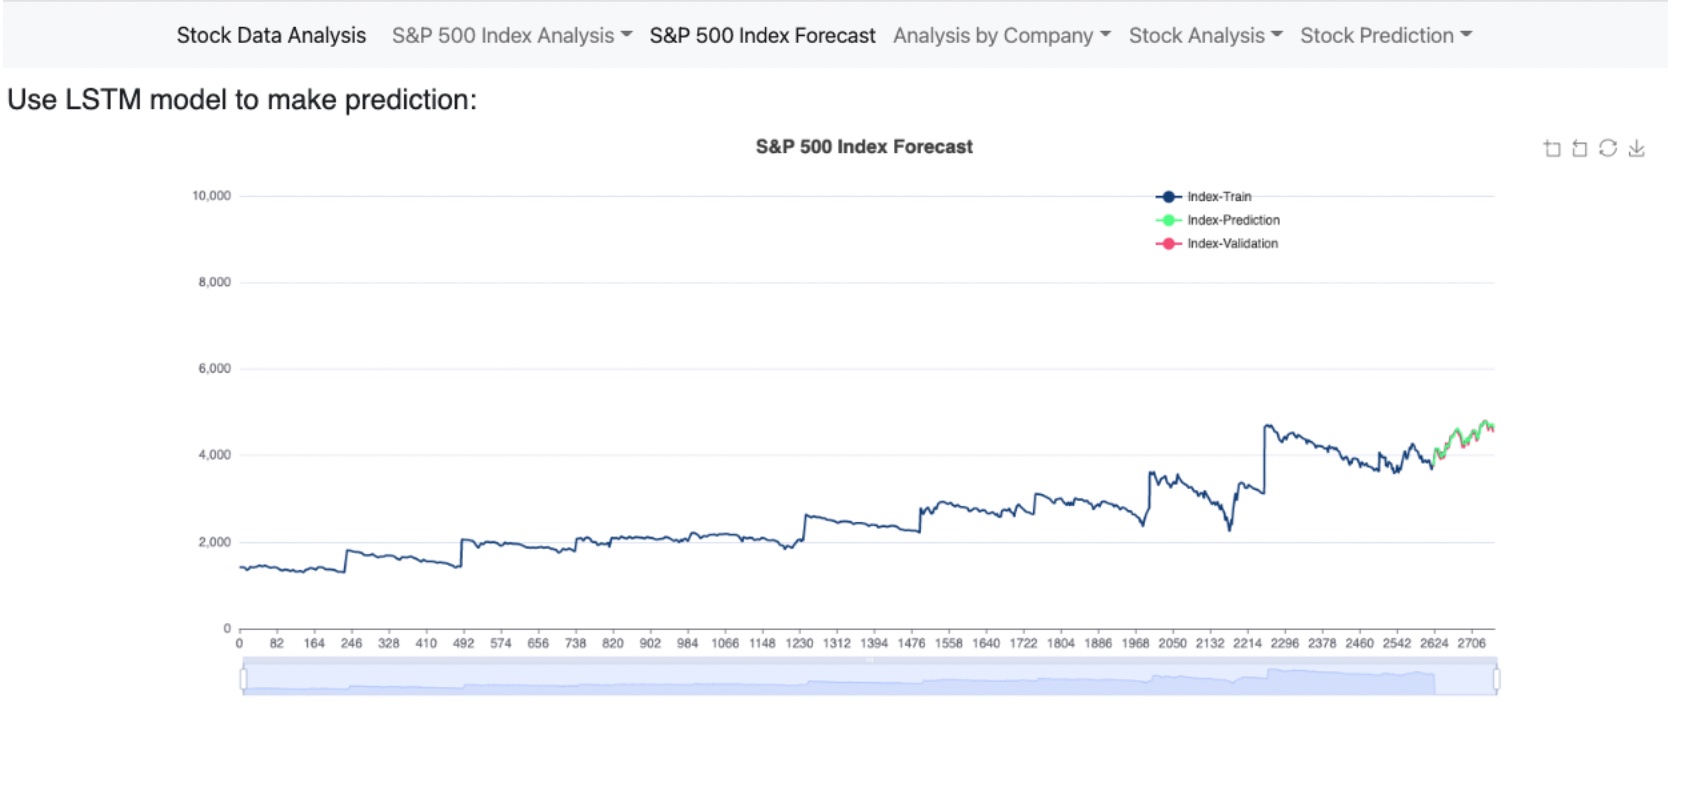
For prediction, we tried and compared predictions with Random Forest and LSTM from framework Keras based on neural networks, and chose the LSTM Algorithms as our model for future prediction methods based on their performance.
2.4 Data Visualization
We chose plotly, matplotlib and Apache Echarts to make data visualization. For Web UI design for massive plot display, we used tabs to split and fold figures into 5 themes, so users can easily choose and check the figures they are interested in.
For App build and deployment, we used docker to containerize our application for easy build and deployment to any platform(local machines, virtual machines or deployed to the cloud). Our application is portable and it is isolated from other containers.
3 Results
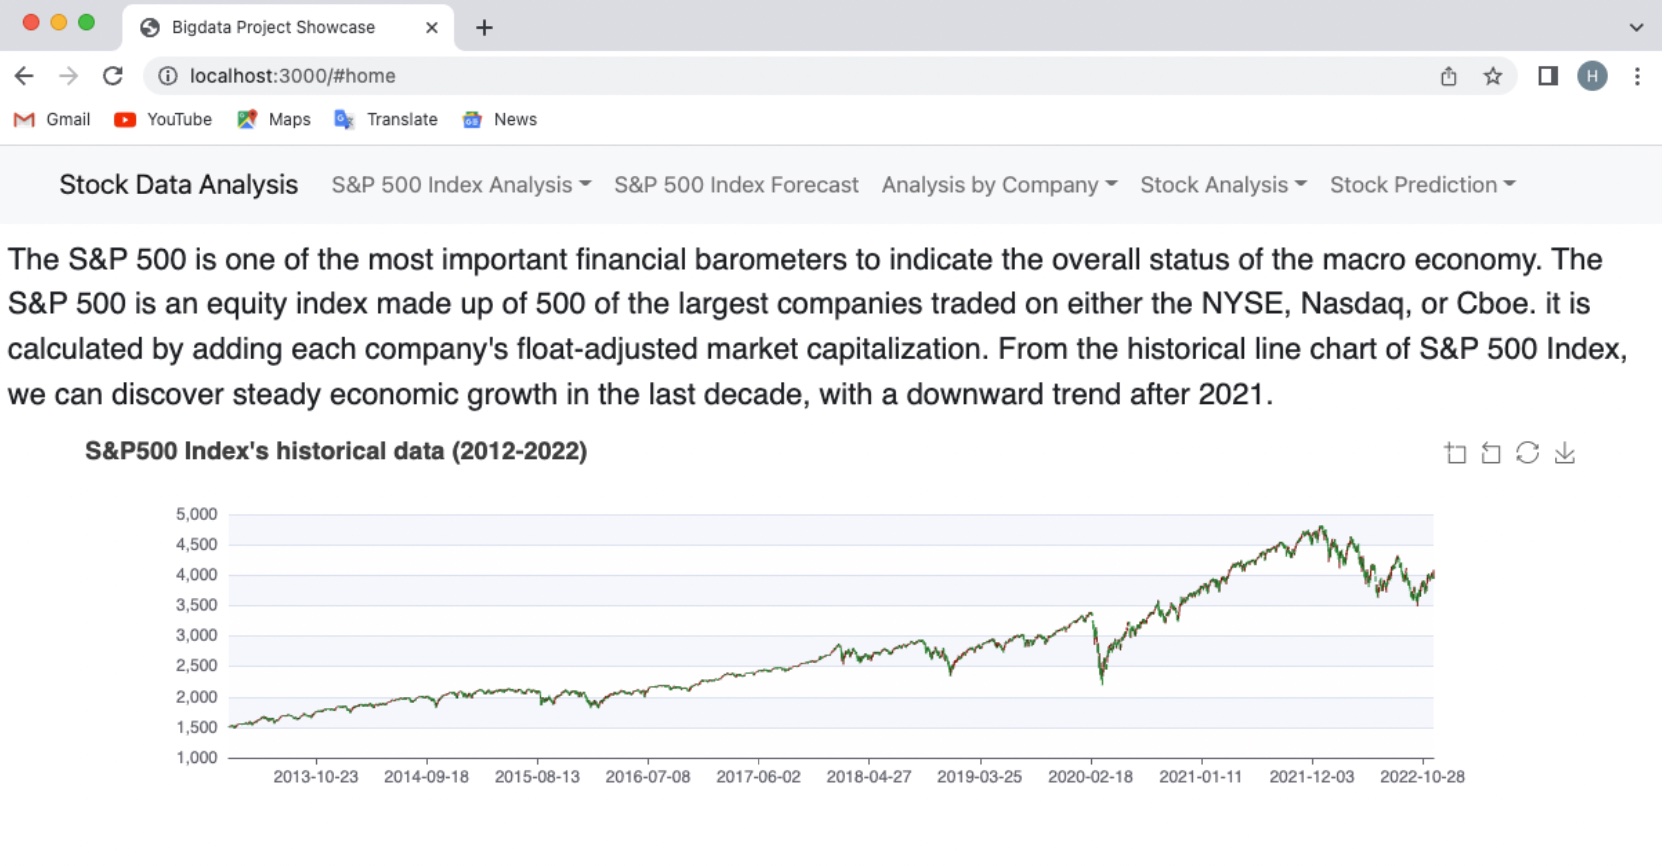
From the S&P 500 Index’s historical data Chart, we can discover steady economic growth in the last decade, with a downward trend in 2020 and 2022. According to the forecast of the S & P 500 Index, it is still fluctuating but has a slightly upward trend, which means that the capital market has rebounded a little now and people can choose some Index Funds to make investment decisions.
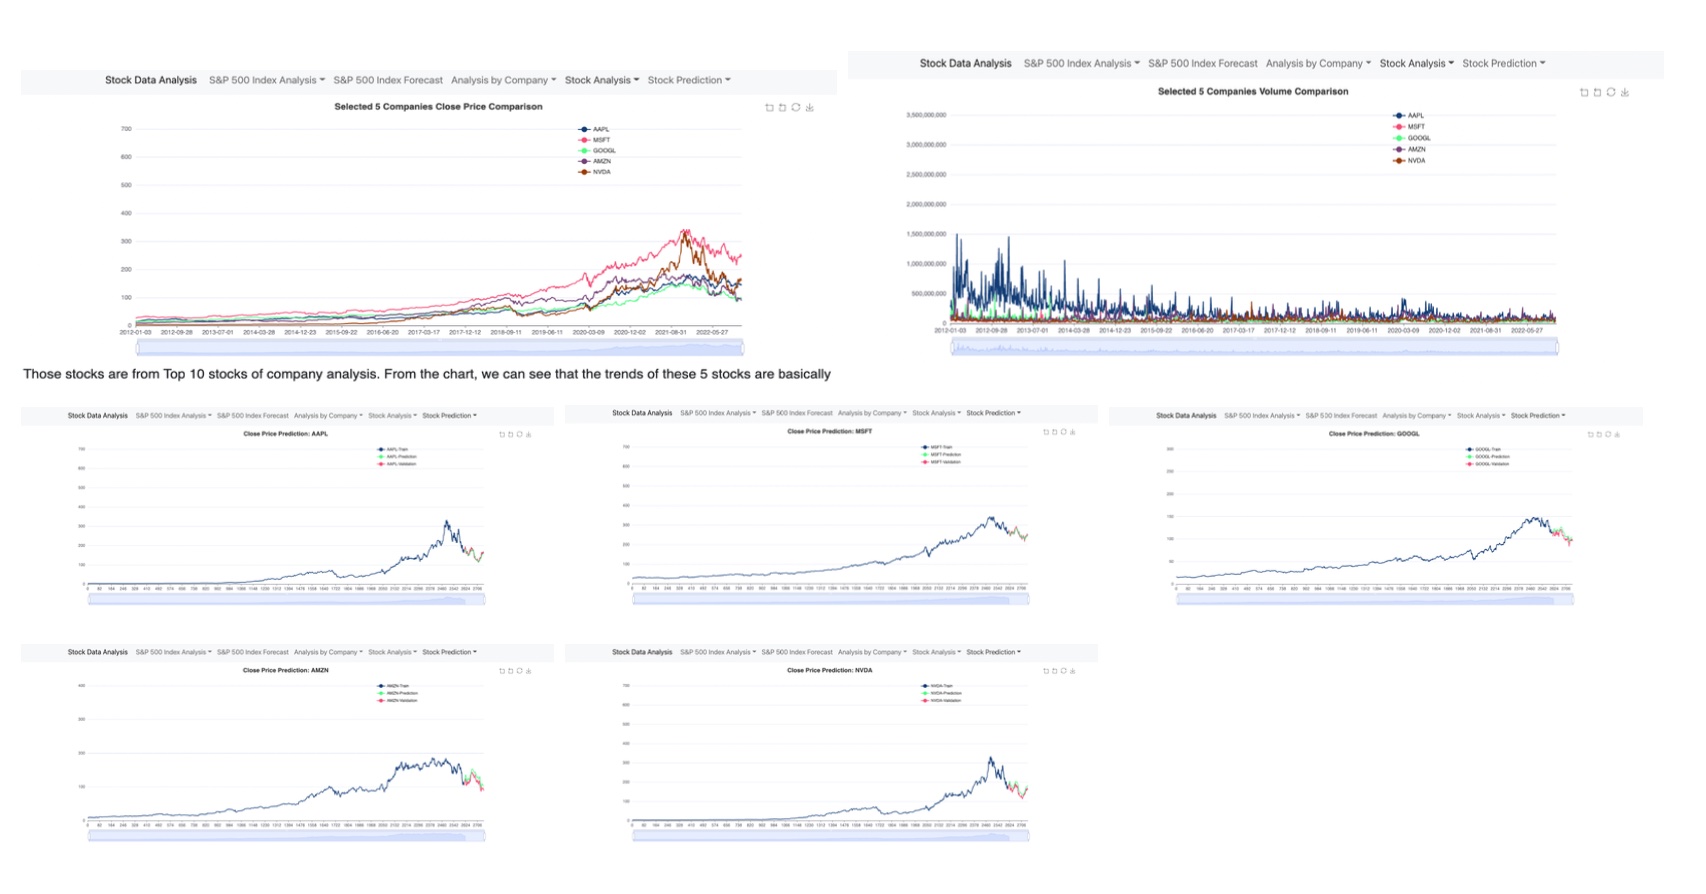
We analyzed the top 10 selected companies in S&P 500 index company list. Based on company analysis chart, we can see that there are 50% high-tech companies in the top 10 companies. So, we further analyzed these 5 high-tech companies and made predictions. From these forecast charts, except AAPL, the predictions of other four stocks seem not promising as S&P 500 Index forecast, so it is not a good time to invest GOOGL, MSFT, AMZN, NVDA. Unlike other four stocks on a downtrend, AAPL has had a small rebound in the float, so AAPL is a potential stock to watch and invest in.
The main goal of this project is to help rookie investors better understand the capital market from the Macro Index, such as the S&P 500 index. From the selected stocks in S&P 500, we made further analysis to show them how to choose good-quality stocks. According to our outcomes, our project is a meaningful tool to let people understand the correlation of macro index and the economy, the trend and forecast of stocks, and how to choose the right time to invest. Also our UI provides a smooth user experience, we created a clean layout with intensive data display and easy for users to zoom in and out to check each point of data in more details.
4.1 Outcomes and Web UI
Home Page

S&P 500 Index Analysis

S&P 500 Index Forecast

Analysis By Company

Individual Company Stock Analysis and Prediction

Tools
Data processing for Big data:
Spark(https://spark.apache.org/)
Database:
Cassandra(https://cassandra.apache.org/_/index.html)
Frontend:
React framework(https://reactjs.org/)
Apache echarts(https://echarts.apache.org/)
React-bootstrap(https://react-bootstrap.github.io/)
Backend:
Python Flask framework(https://flask.palletsprojects.com/en/2.2.x/)
Application containerization:
Docker(https://www.docker.com/)